
Those of you who are B stats students (or less) like me might need a little reminding.
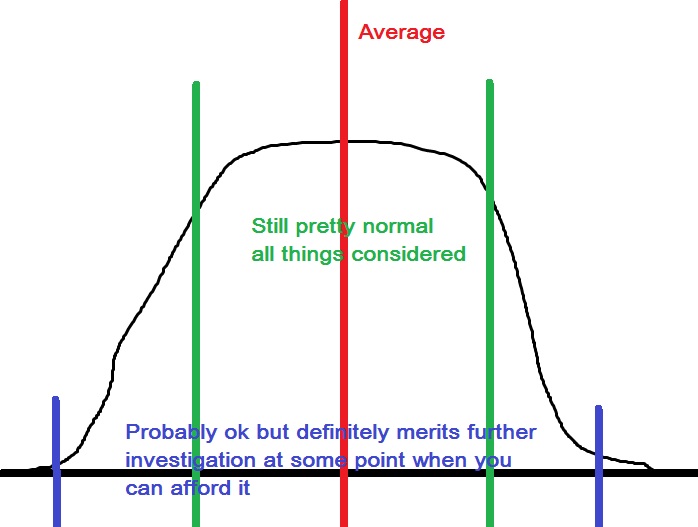
An average is created by some things being higher and some things being lower.
 |
| actually not that far off average |
Most days are going to fall in between the green lines--that's one standard deviation. And those things are all pretty ok for Courage in general.
The blue lines are where things get concerning--that's two standard deviations and you'll notice the incidence drops a lot. It's still not mission-critical MAYBE (or maybe it is), but something is definitely up.
Anything past the blue lines is RED FLASHING LIGHT URGENT DROP EVERYTHING AND CALL THE VET/call trainer to sell horse.
 |
| has opinions even when drugged |
This curve is very specific to an individual horse. I swear some horses are a freaking flat line. (There's one at my barn. Cool horse. Odd.)
As we all know by now, Courage is a complicated, sensitive horse who not only wears his emotions on his sleeve, but also has OPINIONZ about EVERYTHING. The math I do every day is simple--do those opinions fall within a standard deviation of a Courage? If yes, proceed. If no, think it through.
That's how we got body work and teeth done--the OPINIONZ had escalated outside the blue lines and were rapidly accelerating into the green ones.
There's more to it though--the Courage I had last year actually had this inside one standard deviation.

Yeah don't miss that at all.
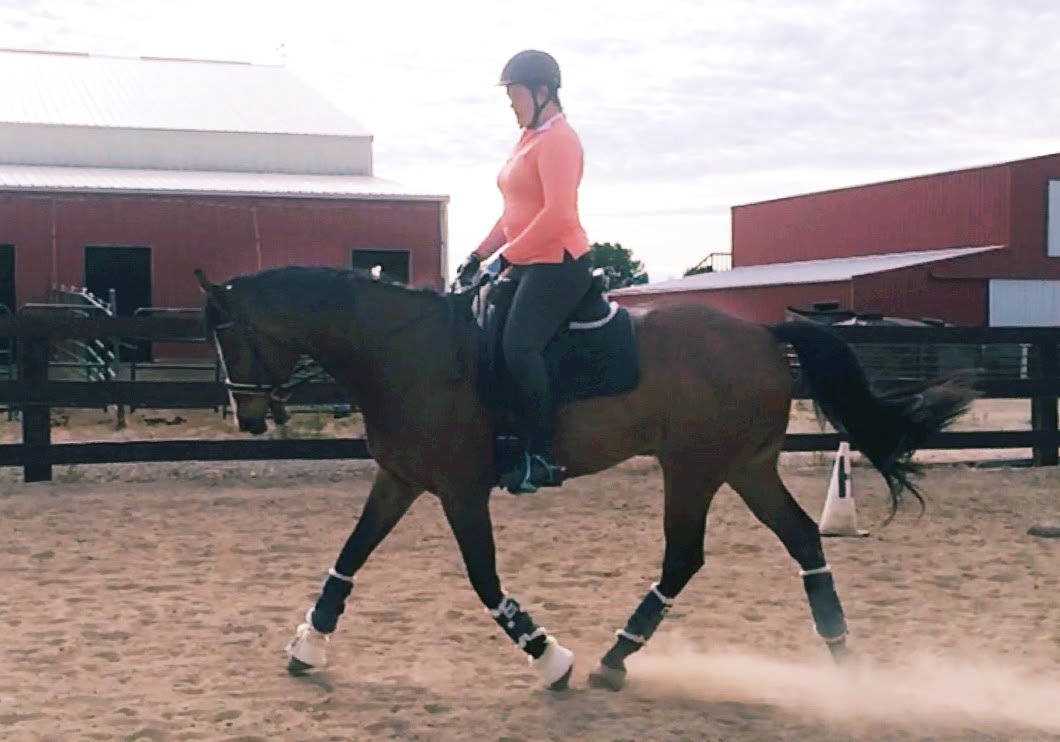
The horse I have this year has deescalated to this:
 |
| my apologies to my trainer for making her ride it |
But not only is the horse a moving target--so are my tolerances. This whole equation only works if his standard deviation fits into what I can deal with. So to some people, the first fail picture is "whatevs NBD" and to others, it's "OMFG NO SELL IT NOW". I fall into the category of "I rode it enough times that I know I can, but I'd rather not".
The second one is pretty hard to be upset about. Yes, Courage didn't want to play in a lesson. Yes, he was a pissy pants and hard to deal with. But meh. Instead of saying "CANT WONT HATE YOU ALL NOT TURNING RIGHT EFF YOU BAI" he's like "screw you i don't want to connect my hind end and soften".
I mean, it's still not a great attitude, but it's hella easier to work with than a full fledged flail. (You're welcome.)
Frankly, when I compare the two shots, which were taken at roughly the same time of year almost exactly 12 months apart, I get a little excited. Look! Things are changing! Maybe someday they'll be good!
 |
| hmmm |
And that's the world as I see it. You see how I didn't even use any numbers to talk about math? It's like how I talk about dressage and never say "outside rein". #magic
#magic It is such a good reminder to go back and see where things were, Courage has come so far! Love the graph!
ReplyDeleteI love the idea of sort of identifying your horses personal bell curve. I'm going to oust some thought into this with Katai. Maybe it will help me freak out less about the small stuff ;)
ReplyDeleteOh, and you guys look absolutely amazing!!
Rock on, sister. Every step to the right is a good one. :0)
ReplyDeleteI love it when the top of my classroom bell curve is 85%. That means my low students are closer to 75%. Imagine your crap rides being a 75%!!!!! You'd be kicking ass. :0)
As someone with a degree in Statistics, this post was my jam. Love!
ReplyDeleteThis makes a lot of sense. It's amazing how stats are good for everything. I've forgotten a lot but I loved stats and was a teaching aid for it in University. :)
ReplyDeleteThere's also the regression towards the mean idea. Which is what happens when you have a stellar training session and it all seems to be rainbows and kittens as far as the eye can see but the next day it's what it usually is. Meghan at Spook at X did a great post on that a while back.